apdex
performance monitor
apdex |
performance monitor |
PROIV Performance Monitor makes use of APDEX (Application Performance Index) calculations. This is an industry standard method for measuring application performance. Use this screen to configure APDEX calculations against currently executing PROIV Web Services. In addition to configuring APDEX calculations, this screen allows association of APDEX calculations with an Alert. When the APDEX score breaches the threshold defined, an alert notification is executed. APDEX scores are expressed as a single decimal number between 0 and 1. The formula for calculating APDEX score is as follows:

To calculate APDEX, the number of samples within a time period is determined and split into three categories:
1. Satisfied Count – This measure is the number of transactions that have completed within the specified Satisfactory Duration.
2. Tolerable – This measure is the number of transactions that have NOT completed within the specified Satisfactory Duration but that have completed within the specified Tolerable Duration.
3. Total Number of samples – The total number of web service transactions that have completed within the specified Sample Period.
To configure a new APDEX score calculation:
Open PROIV Control Panel.
Expand Performance Monitor and then expand Configuration.
Click APDEX.
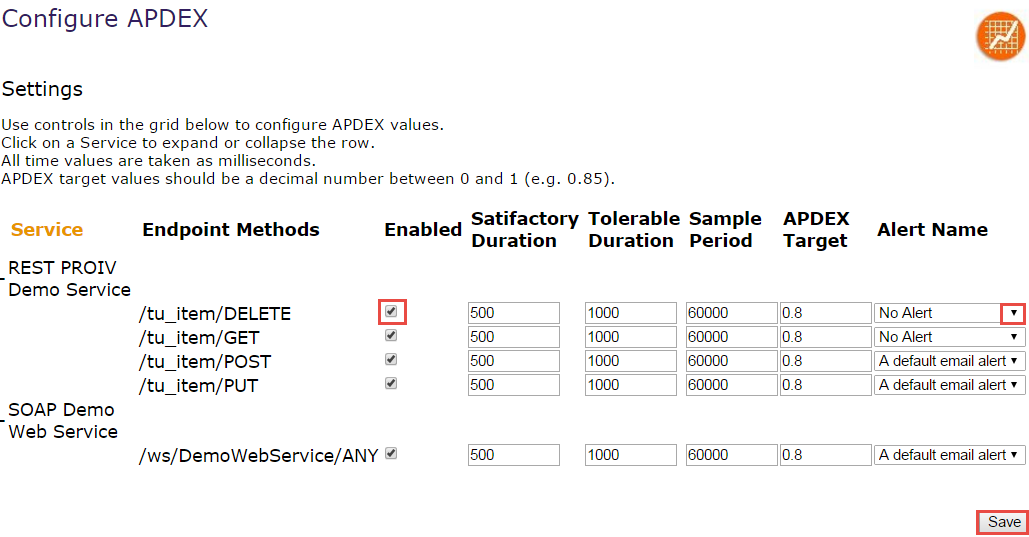
The Configure APDEX page appears with a list of currently configured PROIV web services.
The Endpoint Methods column is used to provide additional information and to distinguish between web services. To view all Endpoint Methods, it is necessary to expand each service in turn.
To the right of the Endpoint Method, default values for APDEX calculation appear. These are inherited from the General Settings page. You can modify the default values, as required. All time values are specified in milliseconds.
To enable APDEX calculation for a specific Service, click the respective check box under Enabled. To disable the process of calculating APDEX for the web service, uncheck the check box.
You can setup an alert, so that a notification is received when the APDEX score breaches the required APDEX Target. This is done by selecting a desired alert from the Alert Name list. For further information, click Configuring Alerts.
Click Save to store the configuration.

Example:
Consider the values specified in the above screenshot. According to the configuration set:
• If the response time of a transaction is less than 500 ms, it is considered as "Satisfied".
• If the response time of a transaction is greater than 500 ms but less than 1000 ms, it is considered as "Tolerable".
Consider a 5-minute Sample Period poll with 288 transactions completing within the period.
• 40 transactions have response times less than 500 ms. Therefore the Satisfied Count is 40
• 200 transactions have response times less than 1000 ms but higher than 500 ms. The Tolerated Count is 200
Applying these figures to the APDEX Score calculation:
APDEX Score = (Satisfied Count + (Tolerating Count / 2)) / Total Samples
Results in an APDEX score of (40 + (200/2))/288 = 0.47
As mentioned, APDEX score is based on a uniform scale between 0 to 1. (0 = Application Performance is low, 1 = Application Performance is high)
As the APDEX Score of 0.47 is lower than the APDEX Target of 0.8; the APDEX Score is deemed to have “breached” the target. Alerts that have been previously configured will be executed.
Topic ID: 220010