apdex dashboard
performance monitor
apdex dashboard |
performance monitor |
The APDEX dashboard provides a means of monitoring the APDEX score of a web service.
Pre-requisite:
You must ensure the configuration in the APDEX settings and General Settings are set as per your business requirement to view the data in the dashboard.
Open PROIV Control Panel.
Expand Performance Monitor and then expand Dashboards.
Click APDEX Dashboard.
The APDEX Dashboard page appears.
To view the data for a specific duration, select a predefined time period in Graph Range or use the Data Range slider to set a custom time period.
The APDEX dashboard displays the chart along with the APDEX metrics.
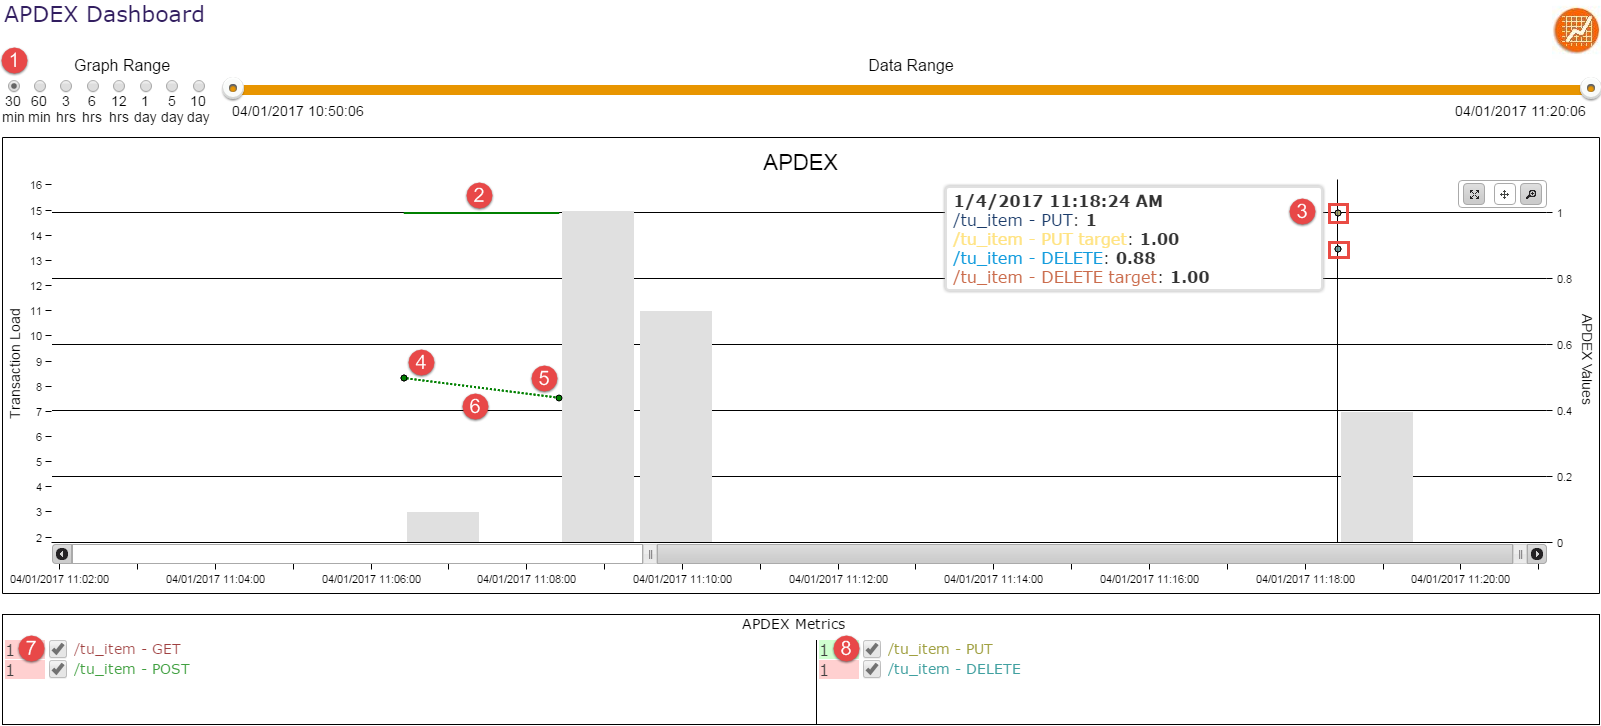
The following screenshot highlights key features of the APDEX dashboard.
|
Note: The dashboard charts displays everything important at a glance and allows you to enlarge an area in the graph, when required. You can use the following controls to adjust the size of the dashboard chart view:
|
|
|
Graph Data and Date Range - Set the time and date range to view the transactions that occurred during the specified date and time. |
|
|
The line indicates the required APDEX target for the transaction. In the above screenshot, the APDEX target for POST method is 1. |
|
|
The tool tip displays the following statistics: Method Executed - name, actual APDEX score and target APDEX value. |
|
|
The data point indicates an actual APDEX value of the POST method executed at specific duration. |
|
|
The data point indicates an actual APDEX value of the POST method executed at specific duration. |
|
|
The dotted line between first point of POST method and second point of POST method indicates an overall trend of the actual APDEX value. |
|
|
The APDEX metrics are highlighted using red and green indication. The displayed number represents the configured APDEX target. If the number is highlighted in red, this indicates that the APDEX score of the GET method has breached the APDEX target at some point in time. An alert is triggered if it is configured. |
|
|
Green indicates that all actual APDEX scores for the PUT method are greater or equal to the APDEX target. |
Topic ID: 220009


