TREE VIEW
Virtual Machine
TREE VIEW |
Virtual Machine |
The Tree view displays the function execution paths that were traversed in the application being profiled. The root of the tree is the entry point into the application or the component. Each function lists all its components that are triggered and the performance data about the function calls.
The Tree view can also expand and highlight the execution path of a function that consumed the most time or was sampled most frequently. Each process in the profiler appears as a root node.
Using this breakdown, you can identify the slowest function and the slowest execution path analysing whether a single function is slow, or a set of functions called together is slow.
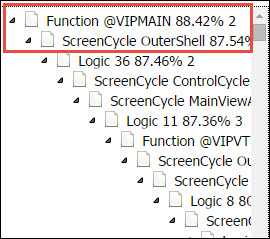
The following is the image of the tree view.
For example, @VIPMAIN is the function that consumed the 88.42 % of the total time including its sub nodes and is invoked two times. OuterShell is the screen cycle which is invoked from the function @VIPMAIN and consumed 87.54% of the total time including its subordinates and is invoked two times in the function @VIPMAIN.
Topic ID: 700056