APPLICATION PROFILER
Virtual Machine
APPLICATION PROFILER |
Virtual Machine |
Use Application profiler to identify the parts of the user application that consumed a disproportionate amount of execution time. For example, if a single function takes up 80% of the execution time, it’s usually worth investigating. The Application profiler does the work for you and saves diagnosing and debugging time.
The Application profiler is completely integrated into the PROIV kernel to provide seamless user experience. It helps you to understand and optimise the performance. Application profiler looks into the functions and allocated objects inside the executing PROIV application and helps you to measure, evaluate and target performance-related issues. You must set the Application Profiler configuration settings in the PROIV Virtual Machine Environment to create a profiling session. During the profiling session the execution time for various PROIV objects is recorded and when the session ends, an analysis file is generated in the specified path with a unique name using the parameters specified by user. The profiler analysis file will have an extension of p4p.
Open PROIV Control Panel and click Virtual Machine Profiler.
A list of existing Profiler Output Files (P4P) appears. This list is automatically refreshed.
Click required Profiler Output File (P4P) to analyse the data.
Adjacent to P4P file, there is a box which is filled with a specific color according to the status of the file. By default, an unprocessed P4P file has white color in it. When you click the P4P file the color changes to red which indicates the file is under process. However, the red color appears for few seconds and then gets converted to green which indicates the P4P file is processed and is ready to display the output.
Note: The .P4P file extension is changed to .p4a representing the file is analysed. A zip folder is created with P4P File, GRIDSON File (stores data to represent in the form of Grid in the Profiler screen) and TREESON File (stores data to represent in the form of Tree in the Profiler screen) in the place of P4P file. In case of any processing errors, an alert appears with Data Load error.
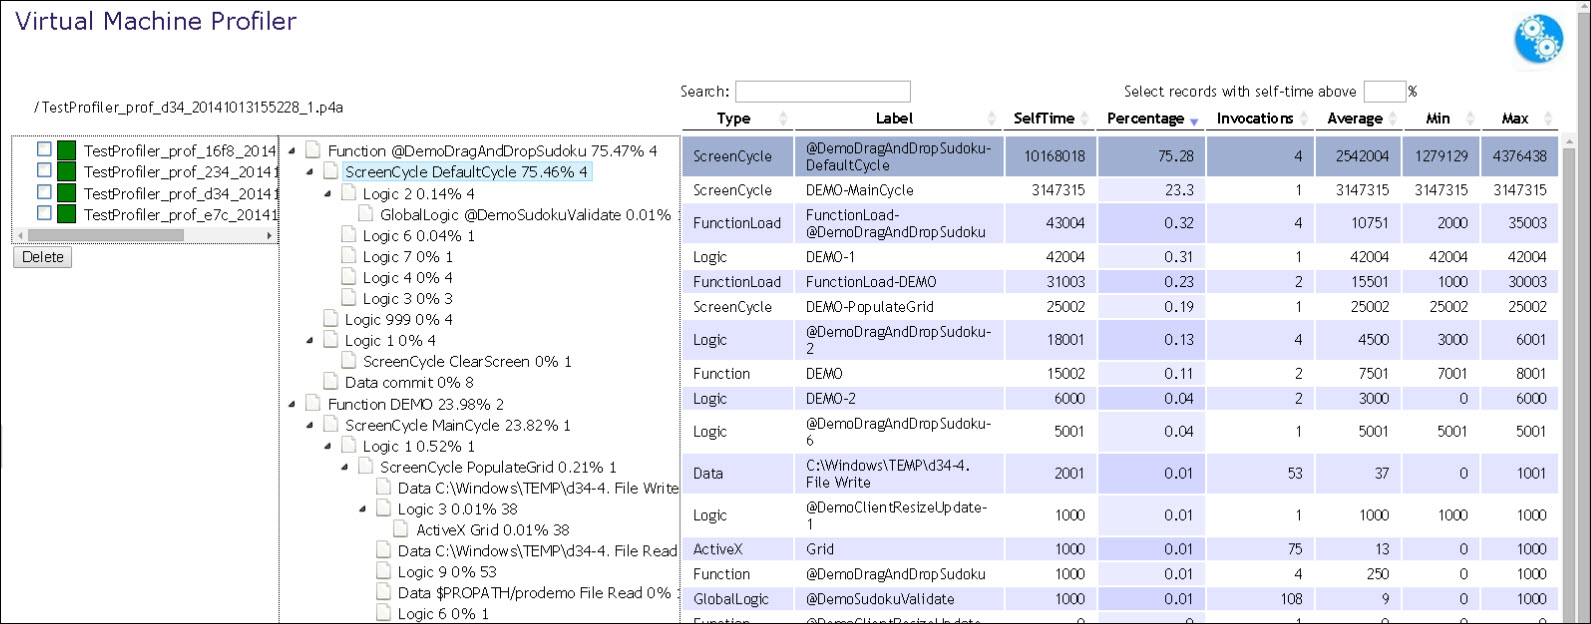
For a successfully analysed profile file, the data appears in panes, the left pane has the display of tree view and the right pane has the display of the grid view. By default, the tree view is expanded and displays the function cycle and its components.
Click output P4P file check box and click Delete.
The file is deleted from the Application Profiler and File system.
Topic ID: 700050