GIRD VIEW
Virtual Machine
GIRD VIEW |
Virtual Machine |
The data appears in a tabular form with the following details
|
Type |
The object type. For example, Screen Cycle, GlobalLogic, FunctionLoad (loading of the function), ReportCycle, Logic and System. |
|
Label |
The component name. For example, @LOGON, @VIPMAIN. |
|
SelfTime |
Duration of the total execution time. |
|
Percentage |
Total percentage of time spent on executing individual component. |
|
Invocations |
Number of invocations of the component. |
|
Average |
Average time that is spent on the component. |
|
Min |
Minimum time that is spent on the component. |
|
Max |
Maximum time that is spent on the component. |
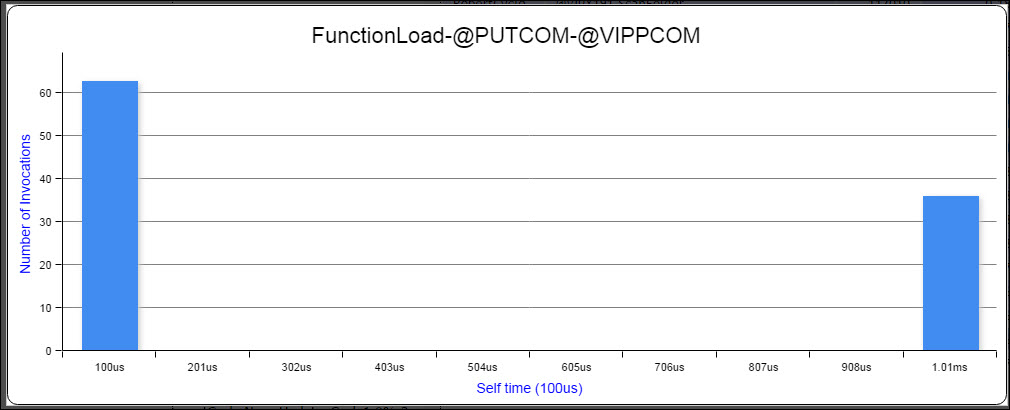
Double-click the node on the grid to view a standard deviation graph.
The graph appears as bar chart with all the details.
To quickly filter specific records, enter the search keyword (full string or partial string) in the Search box.
A list of records appear that match with the search criteria.
Select records with self-time above user specified percentage value
You can filter the records and limit the data that appear in a report to a time segment of the profiling session. You can enter a time segment in the self-time in terms of percentage to view the report. For example, enter "3" – the records with the percentage 3 and above are highlighted in orange color.
Topic ID: 700053