services dashboard
performance monitor
services dashboard |
performance monitor |
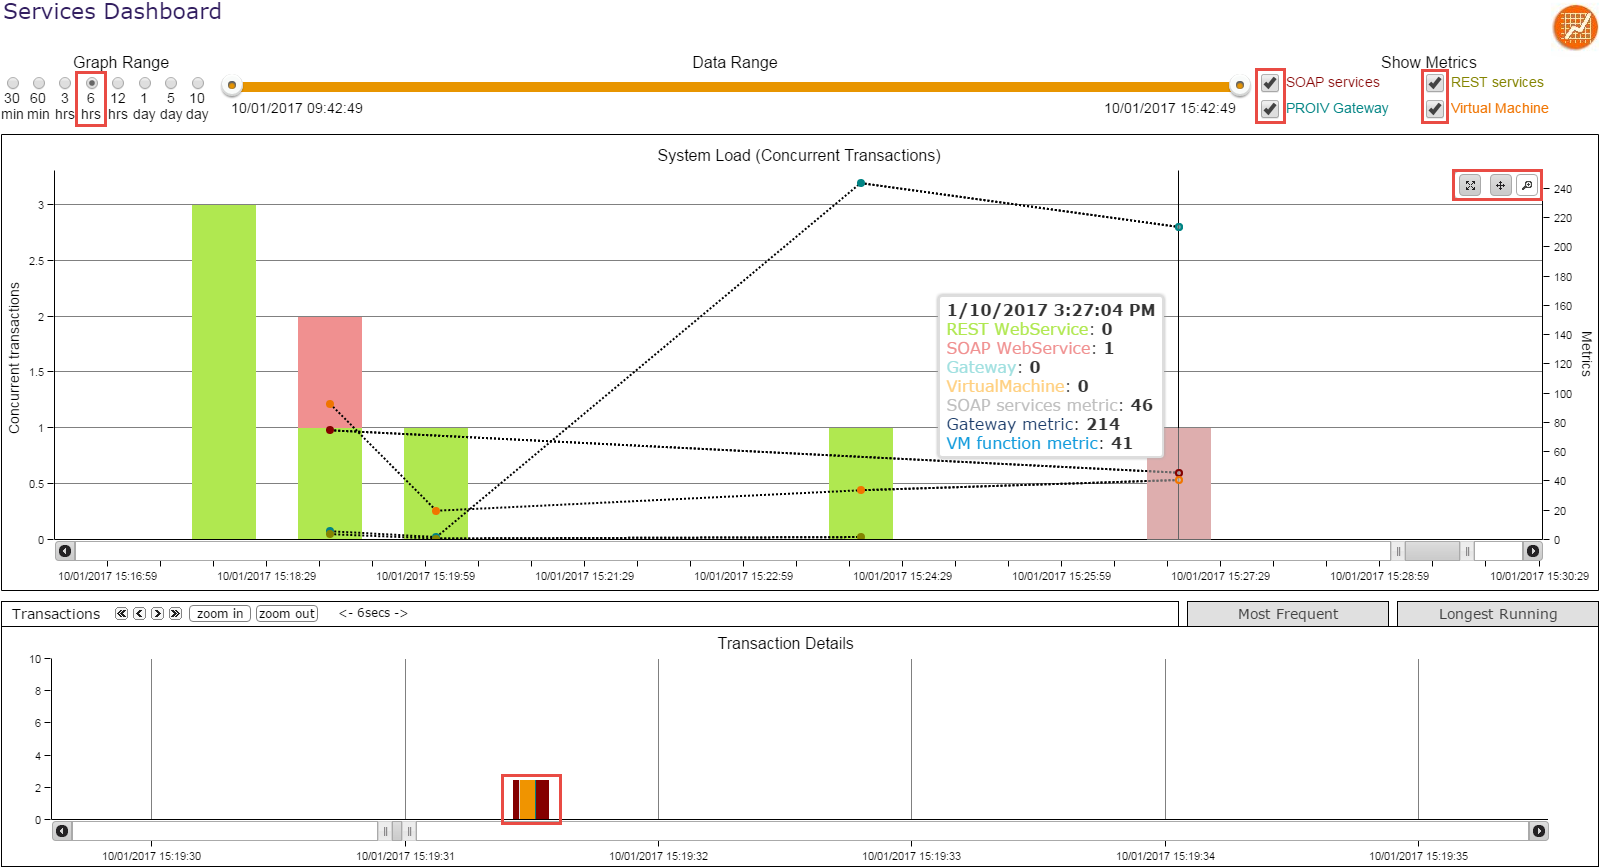
The Services Dashboard provides a means of monitoring the performance of SOAP Web Services, RESTful Web Services, PROIV Gateway calls and Virtual Machine calls (functions, files and SSOs). It displays the ten most frequent and longest running transactions in a tabular format.
Pre-requisite:
You must enable the service in the Data Components to record its performance; only then will the dashboard display the associated data.
Open PROIV Control Panel.
Expand Performance Monitor and then expand Dashboards.
Click Services Dashboard.
The Service Transactions Dashboard page appears.
To view the data for a specific duration, select a predefined time period in Graph Range or use the Data Range slider to set a custom time period.
The dashboard displays the graph as per the time stamp selected.
Under Show Metrics group, select the services for which you want to view the metrics.
The line chart appears with the metrics data.
|
Note: The Show Metrics check boxes remain disabled when there is no metric data to display. For example, if there is no RESTful web service metrics, the check box for REST services remains disabled; however, other metrics that contain data will be available to click its respective check boxes. |
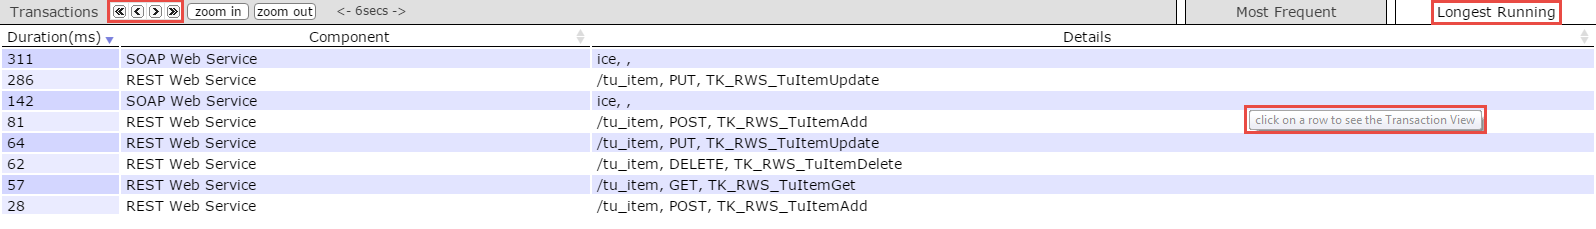
Additionally, the Longest Running transactions and Most Frequent transactions of the selected date range are displayed in tabular format.
Click on the Longest Running tab to view recent ten transactions that consumed highest time.
Click on the Most Frequent tab to view recent ten transactions that were executed most number of times.
|
Note: The dashboard charts displays everything important at a glance and allows you to enlarge an area in the graph, when required. You can use the following controls to adjust the size of the dashboard chart view:
|
For in-depth information and analysis, click a transaction from the Transaction Details area or a row in the Longest Running tab. For further information, refer to Transactions Tree and Events View.
Topic ID: 220016