Getting Started With Code Coverage |
VIRTUAL MACHINE |
Getting Started With Code Coverage |
VIRTUAL MACHINE |
Trail: PROIV Documentation > Developer > PROIV Developer > Code Coverage > Getting Started With Code Coverage
The following is a brief guide to getting started with code coverage.
WARNING: if you intend to distribute functions to third parties then intellectual property can be inadvertently leaked via code coverage. This is a complex issue described in detail elsewhere along with suggested approaches to avoid it happening. For a first time user the recommendation is not to use code coverage on your main development system until you understand this issue. Use it on a copy or a fresh installation of PROIV with functions imported from your main development system, which can be discarded later.
A pre-requisite of using code coverage is that additional information must be generated as functions are built to support code coverage. This is enabled in the PROIV Dashboard. After this is enabled all functions of interest must be re-built to ensure that the additional code coverage is available. This can be done individually or via a bulk-build. Enabling the generation of additional information does not imply functions will be automatically re-built as they are executed. Functions for which code coverage is required have to be explicitly re-built.
Functions without this additional code coverage information will have no data recorded during the capture apart from their name. To indicate being executed by the Virtual Machine but ignored by the code coverage.
Once additional information has been generated for the functions to be used in code coverage then the code coverage can be recorded or captured. This occurs as functions (screens, updates and reports) are executed. The capture process can handle as many functions as you want.
Code coverage capture can be enabled and configured in two ways.
The first is via the configuration settings in the PROIV Dashboard. The Virtual Machine will immediately start trying to capture code coverage data for functions as they are executed. This will not be possible for functions without the additional code coverage information generated for them and a record of them being ignored is kept.
The second way is programmatically via the Session object from inside a logic block. The recommended practice is to write a simple update function to configure and then switch on the code coverage capture. The following is an example update "JWCodeCovOn" with one logic block on entry to the cycle.
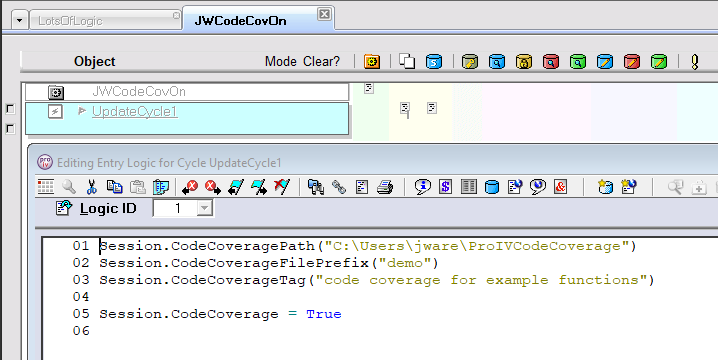
The session is being told to save the capture data: to a specific directory; prefix the filename with "demo";
add a comment (tag) to the file contents. The essential line is "Session.CodeCoverage = True"
which switches on the code coverage capture. After this executing function(s) will capture code coverage data.
The session will continue to do this until it is told to stop (using "Session.CodeCoverage = False") or
the session ends.
Code coverage capture finishes (for a session) when the session ends or it is stopped programmatically using
"Session.CodeCoverage = False".
The code coverage capture can be controlled by both the PROIV Dashboard and programmatically at the same time. The Dashboard specifying the initial values and functions being used to override these in logic via the Session object.
The captured code coverage data is saved as one or more files with a ".p4cc" extension e.g.
"&$@~PROPATH\..\codecoverage\demo_5932_20230117T142836.p4cc".
This data isn't intended to be viewed directly but instead to be processed before being presented as a report (see
next section). There will be (at least) one ".p4cc" file per session containing code coverage for all the functions
(built with additional information) executed in that session. There is not one file per function.
The PROIV instance may have multiple operators each with their own session and so there can be multiple ".p4cc" files.
Developer has its own (batch) sessions.
The code coverage data file can be used to generate a code coverage report and this is done using the PROIV Dashboard. In the Analytics Settings section of the Dashboard you will see the folder where the code coverage data files can be found. By default this is in the PROIV installation but you can change it to be any folder in the machine running the Dashboard. Switch to the Analtyics Operations tab and there is a link that will display the code coverage reporter. This web site allows you to build a report for any of the code coverage data files in the specified folder. See Reporting Code Coverage for details on how to use the reporting web site.
Topic ID: 700081