Reporting Code Coverage |
VIRTUAL MACHINE |
Reporting Code Coverage |
VIRTUAL MACHINE |
Trail: PROIV Documentation > Developer > PROIV Developer > Code Coverage > Reporting
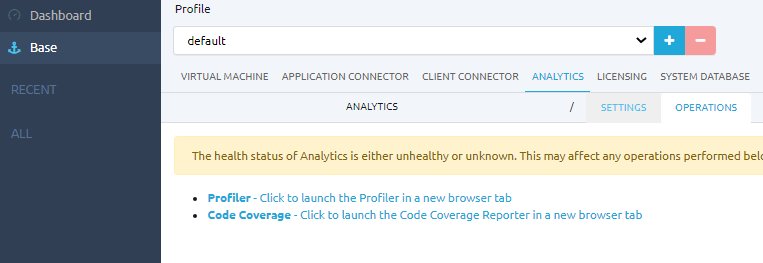
The PROIV Dashboard Analytics Operations section contains a link to the code coverage report web site that allows you to build a coverage report from one or multiple PROIV code coverage data files. The Analytics Settings section contains the path to the folder used by the report web site.
The web site is split into two sections. On the left is a tree view of the code coverage data files found in the folder along with action icons that allow you to manipulate the files and on the right is the code coverage report for one of the data files.
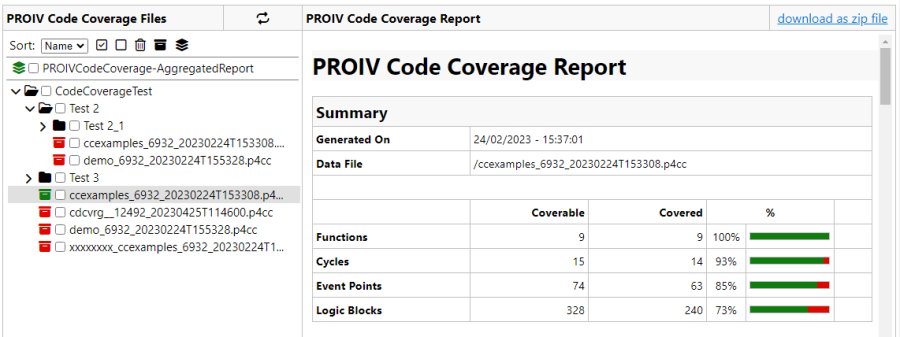
The code coverage data files shown are the files with a ".p4cc" extension that are in the code coverage folder (defined
in the Analytics Settings section) and all its sub folders. When the web site is first displayed it reads the folders
and collects all the data files it finds. There is an icon  at
the top of the web site ("Click to start periodic file scanning") that will cause the web site to scan the folders for data files every 10 seconds.
This allows you to pick up any new data files currently being generated. If scanning is in progress then clicking on the
icon
  will stop the scanning.
The data files can sorted by name or by date using the drop down.
The tree shows a check box for each folder and data file. The data file check box is used to select the file for the icon actions. You can select one or more files for any of the actions. There is a "Click to select all files" action icon for selecting all data files in all folders and a 'Click to un-select all files' action icon for removing all selections. The folder check box will select/un-select all the data files in that folder even if the folder is not expanded and the files are not showing.
Each data file in the tree has a report status icon. This will be red if the data file does not have a code coverage report, yellow if a report is being built and green if there is a report available.
Initially there are no code coverage reports but just clicking on a data file will generate a report for that file that is then displayed on the right. Clicking on a different data file will generate and display a new report for that file. If the data file already has a report generated then clicking on the file just displays the report. This means that the report shown is always for the highlighted data file.
Just above the tree there is a line that references an aggregated report. An aggregated report is one derived from more than one data file. You generate the aggregated report by selecting the required data files and clicking on the "Click to create an aggregated report for all selected files" action icon. There is only one aggregated report clicking on the action icon again will delete the current report and generate a new one. You can save the aggregated report using the zip download link included in the report. You can delete the aggregated report by selecting it and clicking on the delete reports action icon.
The aggregated report line has a report status icon. This will be red if there is no aggregated report, yellow if an aggregated report is being built and green if there is an aggregated report available. If there is an aggregated report available clicking on the aggregated report line will display the report.
The action icons at the top left all work on the selected files. If the action icon requires selected files and no files are selected then the action icon will be disabled. Selecting one or more files will enable the action icons.
 'Click to select all files':
This will select all data files and folders even if they are not showing at present.
 'Click to un-select all files':
This will remove the selection of all data files and folders even if they are not showing at present.
 'Click to delete the reports for the selected files':
This will delete the code coverage report for all the selected data files. This can include the aggregated report. If the
report currently showing is for one of the selected data files it will be removed from the display. This will be disabled
if no data files are selected.
 'Click to create individual reports for the selected files':
This will create a separate code coverage report for each selected data file. This does not include the aggregated report.
If there is a report currently showing it remains unchanged. In other words this action does not affect the current report
view. This will be disabled if no data files are selected.
 'Click to create an aggregated report for all selected files':
This will delete any current aggregated report and create a new aggregated code coverage report for all the selected
data files. This will show the aggregated report when it is ready, replacing any current report showing. You can
view the current aggregated report at any time by clicking on the 'PROIVCodeCoverage-AggregatedReport' line. This will be
disabled if no data files are selected.
If the web site can not perform some action it will generate an error message. An example would be a data file that was manually deleted in the file system and then you try to rename it, or a data file that was not in the valid format and you try to generate a report.
The code coverage report is a web site that consists of a summary page (coverageReport.html) and a page for each function defined in the data. The web site includes all CSS and script files necessary to be stand alone.
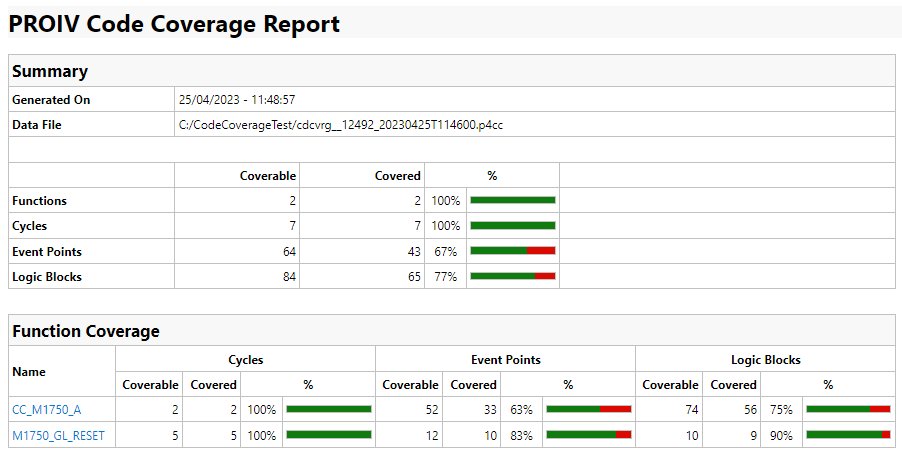
The report summary page (coverageReport.html) shows an overall summary of the code coverage data, a summary of the data for each function and details of any global logics.
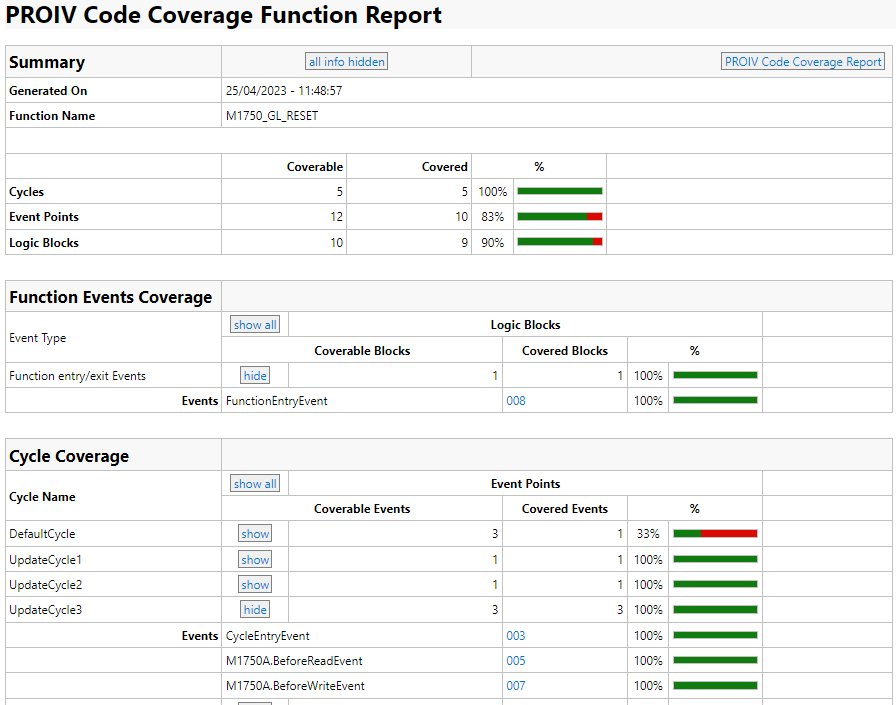
The report function page shows a summary of the coverage for the function, the function events coverage, the function cycles coverage and the function logics.
The function events coverage includes sections on Function entry/exit events, Open Ajax events, Header ControlBreak events and Action Control events. The coverage information is only shown if there is at least one event. For example the Open Ajax section will not be present if there are no Open Ajax events. Each section initially shows only a summary but there is a button that will show full details including the logic being executed for each event (clicking on the logic name will take you to the logic display in this function page). A button at the top will show full details for all sections.
The function cycle coverage shows a section for each cycle in the function. Each section initially shows only a summary but there is a button that will show full details including the logic being executed for each event or function key (clicking on the logic name will take you to the logic display in this function page). A button at the top will show full details for all sections.
PROIV logics are shown in some detail in the report pages. Each logic has a name, the number of logic code blocks, the number of logic code blocks that have been covered (executed) and a percentage of blocks covered. This is followed by the logic source. This source is split up into logic blocks which are then colour coded. Green means the block has been covered (executed at least once), red means that a block has not been covered (not executed) and yellow indicates a code branch decision block. When the mouse is moved over a block the whole block is highlighted to make it clear where the block starts and ends. The code decision blocks also highlight the blocks involved in the decision.
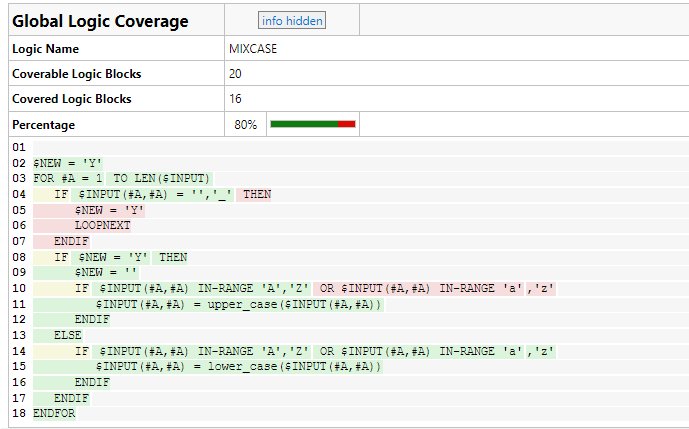
Each block also contains additional information that is not initially shown. To make this visible you need to click on the info button ("info hidden") at the top of the logic section and this will enable a message when the mouse is hovered over a block. A normal block will show the block number, the line and column of the end of the block and a count of the number of times the block has been executed. The code decision blocks have additional information. If you want to have this information available for all logics then there is button at the top of the page to hide/show information for all logics.
There is a button at the top of the logic display that will take you to the event that is calling the logic.
The report has a link that lets you download the full report as a zip file. This zip file contains the report folder and all the report pages. If this is unzipped on a PC then double clicking on the coverageReport.html file should let you view the report on your browser.
Topic ID: 700083