|
grid view |
proiv dashboard |
 |
Grid View
The data appears in a tabular form with the following details
|
Field Name |
Description |
|
Type |
The object type. For example, Screen Cycle, GlobalLogic, FunctionLoad (loading of the function), ReportCycle, Logic and System. |
|
Label |
The component name. For example, @LOGON, @VIPMAIN. |
|
SelfTime |
Duration of the total execution time. |
|
Percentage |
Total percentage of time spent on executing individual component. |
|
Invocations |
Number of invocations of the component. |
|
Average |
Average time that is spent on the component. |
|
Min |
Minimum time that is spent on the component. |
|
Max |
Maximum time that is spent on the component. |
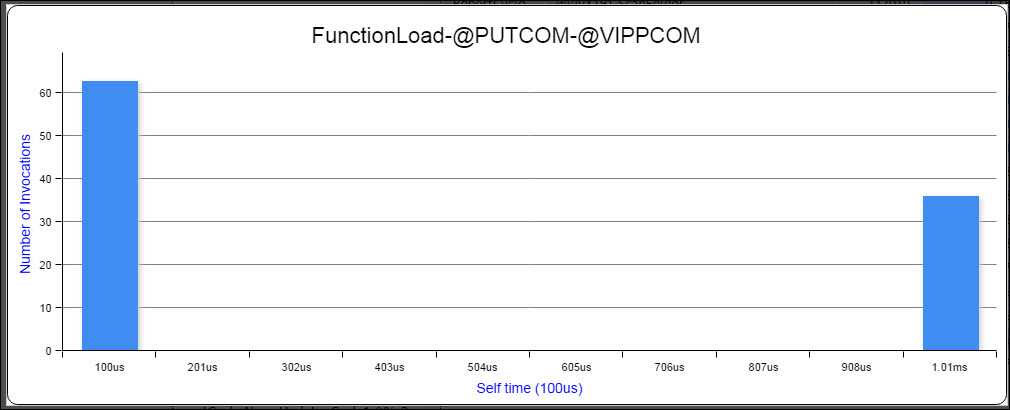
Double-click the grid row to view a standard deviation graph.
The graph appears as bar chart with all the details.

Search Records
-
To quickly filter specific records, enter the search keyword (full string or partial string) in the Search box.
A list of records appear that match with the search criteria.
Select records with self-time above user specified percentage value
You can filter the records and limit the data that appear in a report to a time segment of the profiling session. You can enter a time segment in the self-time in terms of percentage to view the report. For example, enter "3" – the records with the percentage 3 and above are highlighted in orange color.
Topic ID: 820005


