


|
analyzing profiler results |
proiv dashboard |
 |
Analyzing Profiler Results
The profiler trace file contains event logs of a task that measures, for example, the memory or time complexity of a task and the duration of function calls. You can analyze the trace file logs in a Viewer - a set of views which give you different perspectives such as tree view and grid view on the collected data.
When the trace file is created, adjacent to it, there is a box which is filled with a specific color according to the status of the file. By default, an unprocessed P4P file is white in color. When you click the P4P file the color changes to red which indicates the file is under process. However, the red color appears for few seconds and then gets converted to green which indicates the P4P file is processed and is ready to display the output.
-
On the Analytics page, click Operations tab and then expand Profiler.
-
Click Profiler.
The PROIV Profile Viewer appears on the new tab. -
Click the check box of the Profiler Output File (P4P) to analyze the data.
-
For a successfully analyzed profile file, the data appears in panes, the left pane has the display of tree view and the right pane has the display of the grid view. By default, the tree view is expanded and displays the function cycle and its components.
To delete the Profiler File:
-
Click output P4P file check box and click Delete.
The file is deleted from the PROIV Profiler and File system.
Activating PROIV Performance Monitor
You can activate the performance monitor for the required instance of your client application. By default, all deployment instances which had the components enabled for performance monitoring appears. You can use a deployment filter to select a particular instance to enable performance monitoring.
To record and analyze performance of a particular PROIV component, you must enable the component's instance. This section displays a list of components that have registered for performance monitoring and allows you to enable/disable performance monitoring for these instances.
-
On the Analytics page, click Operations tab and then expand PPM Activation.
-
Under the Deployment Filter, select the deployment instance. For example, base-default.
-
To enable a particular instance of the component of the selected deployment instance, click the check box for the components that are displayed under Enable Monitoring and then click Submit.
-
Re-deploy the Analytics component.
Exporting PROIV Performance Monitor Data
You can archive performance monitor data by exporting APDEX and transactions to a CSV File. This may be useful if there is a need to retain data older than the retention period.
-
On the Analytics page, click Operations tab and then expand PPM Data Export.
-
To export the APDEX data to a Comma Separated Value (CSV) file, click Export APDEX.
The APDEX data is exported to a csv file and is downloaded. The file is stored as a zipped archive in the specified location. Extract the zip file to a folder to view the files. -
To export the transactions that are recorded in the Performance Monitor database to a Comma Separated Value (CSV) file, click Export Transactions.
The transactions are exported to a csv file and is downloaded. The file is stored as a zipped archive in the specified location. Extract the zip file to a folder to view the files.
Working with PPM Dashboards
PROIV Performance Monitor Dashboard is a business management tool used to visually represent the performance of an application, a specific component, or a key business operation. Information is presented using visualizations, such as charts, graphs, and tables that are bound to data sources. These components display the data in a compact and visual manner to help the dashboard user identify trends and make informed business decisions.
PPM Dashboards provides an easy way to create customized business dashboards for the selected PROIV components to drive faster decision-making based on the analysis.
You can create personalized dashboards to monitor your most important data, at a glance. A dashboard combines all service transactions with the time stamp range of 30 minutes to 10 days and a check box to select the transaction type in a single window pane, providing a consolidated view across the application regardless of where the data lives. Each metric, or insight, is displayed on the dashboard as a dotted line graph.
-
On the PROIV Analytics page, click Operations tab and then expand PPM Dashboards.
The Services, Interactive and Apdex dashboards are displayed. -
Click Services to view the Services dashboard. The Services Dashboard provides a means of monitoring the performance of SOAP Web Services, RESTful Web Services, PROIV Gateway calls and Virtual Machine calls (functions, files and SSOs). Refer to Services Dashboard for more information.
-
Click Interactive to view the Interactive dashboard. The Interactive dashboard provides a means of monitoring the performance of the OpenClient (Browser and Server), MFC and Virtual Machine components. Refer to Interactive Dashboard for more information.
-
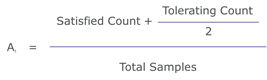
Click Apdex to view the APDEX dashboard. The APDEX dashboard provides a means of monitoring the APDEX score of a web service. Refer to APDEX Dashboard for more information.
Related Topics:
Topic ID: 820001