


|
CACHE STATISTICS |
Virtual Machine |
 |
Each kernel process in UNIX maintains its own internal caches. You can obtain cache metrics for the individual caches so that application systems management can determine the optimum settings for the cache size configuration.
Additionally, you can view the state of the cache and choose to display the cache statistics screen in the application or use another Function (Report or update) to report or record the cache utilization before the process exits. Cache metrics are lost when the process exits.
You can view the cache position in the current kernel session using PROIV Administrator and PROIV Developer.
-
Open PROIV Developer, click Admin and then select Tools. (or)
-
Open PROIV Administrator, click General Tools Tab, and click Utility menu in character mode.
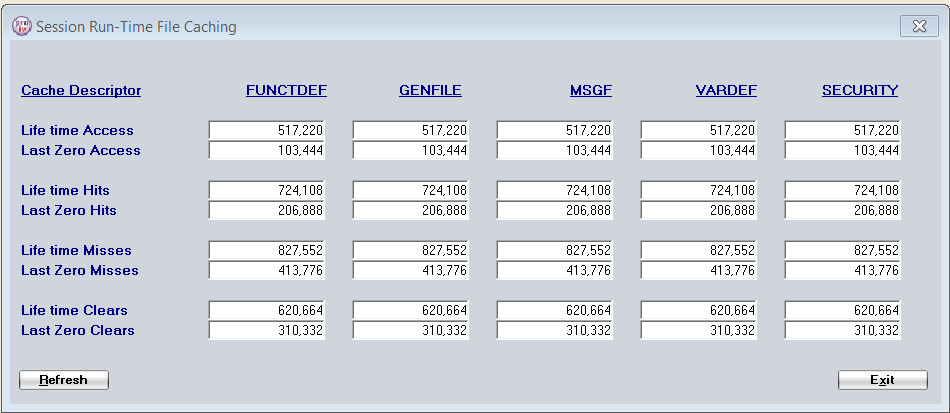
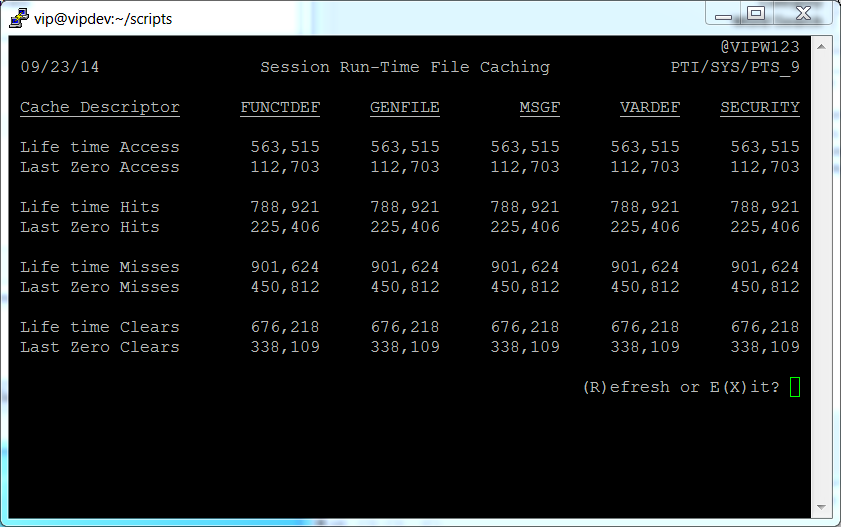
Each of the cache has following metrics:
Process Lifetime Metrics
-
lifetimeHits - total number of hits
-
lifetimeAccess - total number of accesses
-
lifetimeCacheClears - total number of cache clears
-
lifetimeCacheMiss - total number of partial cache misses
Since last call to ZeroRuntimeCacheMetrics()
Allows the current cache metrics to get clear as and when the application developer considers the cache to get populated by the executing process. If the cache works, then the subsequent calls to GetCacheMetrics shows full cache utilization without any clears, however if the cache size is not suitable it gets cleared.
-
currentHits - number of hits on the cache since last call to ZeroRuntimeCacheMetrics
-
currentAccess - number of accesses to the cache since last call to ZeroRuntimeCacheMetrics
-
currentCacheClears since last call to ZeroRuntimeCacheMetrics
-
currentCacheMiss since last call to ZeroRuntimeCacheMetrics
GUI Screen
Green Screen
Topic ID: 700051