Transactions tree view |

performance monitor |
 |
Transactions View
The transaction tree view profiles the performance details for a single transaction. A transaction is selected in the Services or Interactive dashboard by clicking on a row in the Longest Running table or by clicking on a transaction displayed in the Transactions Details.
The transaction view pops up as a panel that fill most of the screen, to dismiss the panel click X at the top right of the panel or anywhere outside the panel.
The transaction view shows the details related to a single transaction. The top of the panel displays the details that identify the transaction along with the start and end time stamps. There are two views: Transaction Profile and Transaction Events.
This is the default view for a transaction. It displays the progress of the transaction that is split into the units of processing in the order in which they occur.
Each row in the tree represents a unit of processing. The row has an icon which identifies the component that performs the processing along with a brief description of the processing. A unit of processing may contain within it other units of processing, in which case it will have an arrow to expand or contract the view of those sub units. Each row has five data fields that are defined in the following tabular format. Hovering the mouse over the various parts of a row will display tooltip information.
Data Fields
|
%Total |
The percentage of the total transaction time that is taken by the unit of processing including any sub processes. |
|
%Self |
The percentage of the total transaction time that is taken by the unit of processing but excluding any sub processes. |
|
Total |
The time in milliseconds that is taken by the unit of processing including any sub processes. |
|
Self |
The time in milliseconds that is taken by the unit of processing excluding any sub processes. |
|
%Parent |
The percentage of the parent processing time that is taken by the unit of processing including any sub processes. |

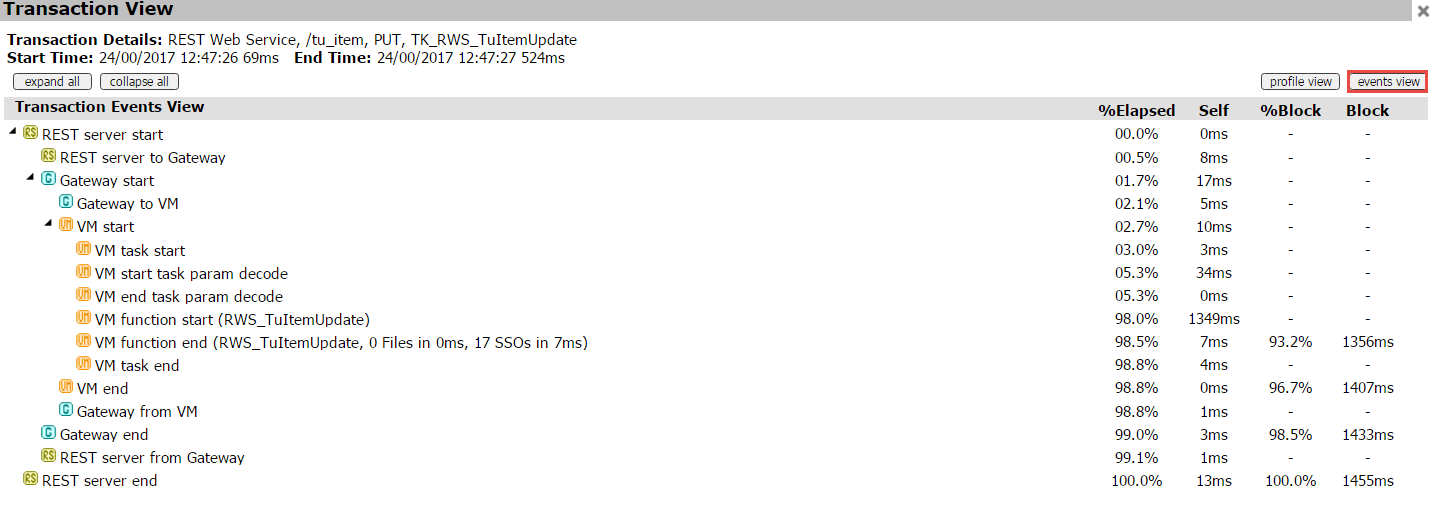
This view shows the progress of the transaction as events in the order in which they occur. This is view can be selected at any time by clicking on the ‘Events View’ button at the top right.
Each row in the tree represents a single event in the transaction life cycle. The row has an icon that identifies the component that generated the event along with a description. If an event is the start of a block, it will have an arrow to expand or contract to display or hide its sub events.
Hover the mouse over the various parts of a row to view tooltip information. You can also move the mouse onto one of the block data fields in a block end event; this highlights the current block. Each row has four data fields that are defined in the following tabular format
Data Fields
|
%Elapsed |
The percentage of total transaction time taken up to this event. |
|
Self |
The time in milliseconds since the previous event. |
|
%Block |
The percentage of the total time taken by a block of events. This is only displayed on an event that terminates a block of events. |
|
Block |
The time in milliseconds that is taken by a block of events. This is only displayed on an event that terminates a block of events. |

VIRTUAL MACHINE FUNCTIONS
In both views the PROIV Virtual Machine functions are displayed with the function name and the number of files and SSO accessed in that function along with the execution time. The total time taken by the function may well be longer than the file and SSO access time as the function will be doing other processing that is not explicitly displayed.
NOTES ON THE TIMING DATA
The time stamp information in the event data is given in milliseconds. This means that any processing that takes less than 1 millisecond will show a time of zero.
The time taken for a transaction can be shown as different in the two views. This can be for several reasons:
-- Parallel Processing
The processing units in the various components are not necessarily happening sequentially as some processing may be going on at the same time in two components (this is often true with the OpenClient and the Virtual Machine). This can cause the Profile view to show a longer time for a transaction than the Events view.
-- Component Clocks
The clocks that generate the time stamps for the events in the different components are not necessarily synchronized. If all the components are in the same machine then the clocks will be in step so the event time stamps can be relied upon to show the true time between events in different components, but if any components are in a different machine (highly likely in a production environment) then the clocks may be different. This will cause the times between events in different components to be unreliable.
-- Network Delays
The time taken for the components to pass information between themselves will depend on the network performance. Due to the problem with component clocks, you can not reliably measure this using the component clocks, so the Profile view excludes the network time from its timing calculations. This can cause the Profile view to show a shorter time for a transaction than the Events view.
Topic ID: 220021


